How to create a flowchart
A flowchart is a picture of a process: a series of steps joined by arrows, with diamonds wherever a decision sends the flow one way or another. Flowcharts are older than software, which is exactly why they work so well: almost anyone can read one without training.
This guide covers the standard symbols, a simple method for drawing a clear flowchart, and how to write one as text using Mermaid flowchart syntax, which Dev Studio's Flow Diagram tool understands.
The standard flowchart symbols
You only need a handful of shapes. Here they are with the Mermaid syntax that produces each one:
| Shape | Meaning | Mermaid syntax |
|---|---|---|
| Rounded pill (terminator) | Start or end of the process | A([Start]) |
| Rectangle | A step or action | B[Check stock] |
| Diamond | A decision with two or more exits | C{In stock?} |
| Parallelogram | Input or output, such as a form or report | D[/Enter address/] |
| Cylinder | A database or stored data | E[(Orders DB)] |
| Rectangle with side bars | A sub-process described elsewhere | F[[Run payment flow]] |
| Circle | A connector or small milestone | G((Done)) |
A six-step method
- Name the process and its boundaries. Decide exactly where it starts ("customer opens a support ticket") and where it ends ("ticket closed").
- List the steps in order as short verb phrases. Don't draw anything yet.
- Mark the decisions. Any step that sounds like a question ("Is it urgent?") becomes a diamond.
- Decide where each branch goes. Every exit from a diamond needs a label and a destination; a missing branch is the most common flowchart bug.
- Draw it, top to bottom or left to right, and keep arrows from crossing where you can.
- Walk through it with a real case. If you get stuck or need a step that isn't there, the chart is incomplete.
Writing a flowchart in Mermaid
Mermaid is a text-based diagram language. A flowchart starts with flowchart followed by a direction: TD (top-down), LR (left to right), BT or RL. Then each line connects two nodes:
flowchart TD
    A([Ticket opened]) --> B{Urgent?}
    B -->|Yes| C[Page on-call engineer]
    B -->|No| D[Add to queue]
A node is defined the first time you use it, with an ID (A) and a label in the shape's brackets. After that, refer to it by its ID alone. Arrows come in several styles:
| Syntax | Result |
|---|---|
A --> B | Arrow |
A --- B | Line without an arrowhead |
A -.-> B | Dotted arrow, often used for optional or async steps |
A ==> B | Thick arrow, to highlight the main path |
A -->|label| B or A -- label --> B | Arrow with a label |
A & B --> C | Several arrows at once |
Worked example: support ticket triage
This example uses decisions, a loop back, a database and a subgraph to group the engineering steps:
flowchart TD
    A([Ticket opened]) --> B{Urgent?}
    B -->|Yes| C[Page on-call engineer]
    B -->|No| D[/Categorise ticket/]
    D --> E{Known issue?}
    E -->|Yes| F[Reply with help article]
    E -->|No| G[Assign to specialist]
    subgraph Engineering
        C --> H[Investigate]
        G --> H
        H --> I{Fixed?}
        I -->|No| H
    end
    I -->|Yes| J[(Log in ticket DB)]
    F --> J
    J --> K([Ticket closed])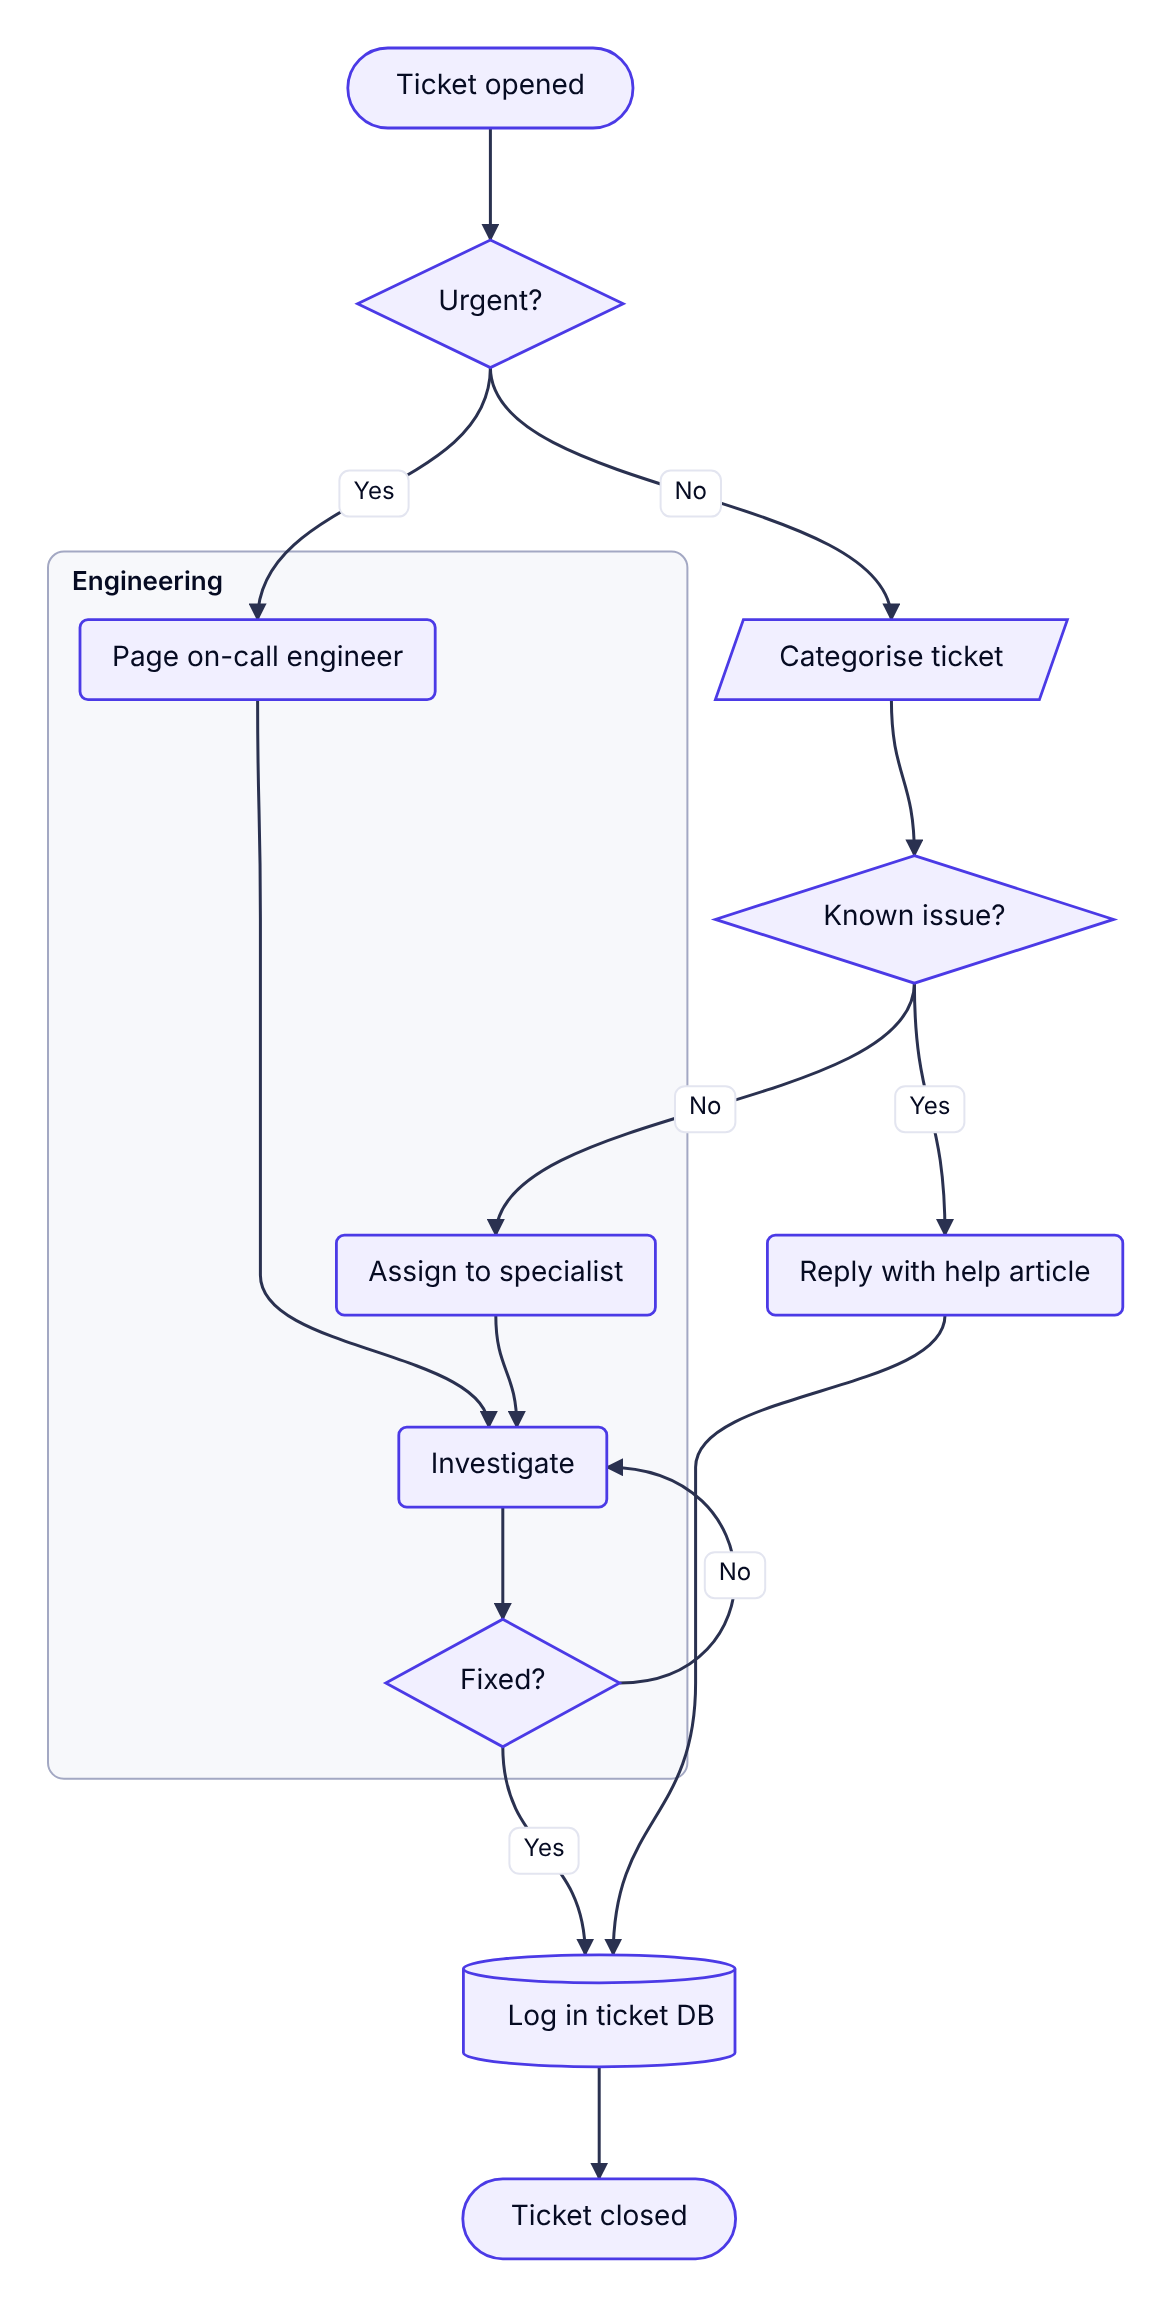
The I -->|No| H line points backwards, so Dev Studio routes it around the side to show that investigation repeats until the issue is fixed.
Tips for clear flowcharts
- One start, clearly marked. Readers should never wonder where to begin.
- Label every decision branch. "Yes" and "No" are fine; unlabelled exits are not.
- Keep steps at the same level of detail. "Process payment" next to "Click the blue button" is a sign that one of them belongs in a sub-process.
- Prefer top-down for long processes and left-to-right for short pipelines.
- Use subgraphs for ownership. Grouping steps by team or system makes hand-offs visible.
Flowchart or activity diagram?
For most processes either works. Choose a UML activity diagram when you need to show work happening in parallel (fork and join bars) or responsibilities in swimlanes. Choose a flowchart when the audience is non-technical or the process is mostly a chain of decisions.
style, classDef and click are accepted but ignored.