What is PlantUML and how does it work?
PlantUML is an open-source tool that turns short, plain-text descriptions into diagrams. Instead of dragging boxes around a canvas, you write a few lines such as Customer -> Shop: Place order, and PlantUML works out where every box, arrow and label should go.
This guide explains what PlantUML is, how the text-to-diagram process works, what you can draw with it, and when it is (and isn't) the right choice.
The idea behind "diagrams as code"
Most diagramming tools store a picture. PlantUML stores a description of the picture. That small difference has big practical effects for software teams:
- Diagrams live next to the code. A
.pumlfile can sit in the same repository as the service it describes and be reviewed in the same pull request. - Changes are easy to read. A diff shows that a message was renamed or a step was added. A diff of two PNG files shows nothing useful.
- Nobody fiddles with layout. You describe relationships; the tool positions them. Adding a participant in the middle doesn't mean moving ten other shapes.
- Diagrams are reproducible. The same text always produces the same diagram, so documentation can be regenerated automatically.
PlantUML was created by Arnaud Roques and is written in Java. It is free software, and it is built into or supported by many editors, wikis and documentation tools.
How PlantUML turns text into a picture
Every diagram goes through roughly the same three stages:
- Parsing. PlantUML reads the text between
@startumland@enduml, works out which kind of diagram it is, and turns each line into a structured element: a participant, a message, a decision, a note. - Layout. It calculates positions. For sequence diagrams it uses its own engine, which places participants left to right and messages top to bottom in the order you wrote them. Several other diagram types (class, component and use case diagrams, for example) rely on the Graphviz layout engine to arrange boxes and lines.
- Rendering. Finally it draws the result as an image, usually PNG or SVG.
You can run PlantUML as a command-line program, through editor plugins (VS Code and IntelliJ both have popular ones), or through a PlantUML server that renders diagrams on request.
Your first PlantUML diagram
Here is a complete sequence diagram. Lines starting with ' are comments and are ignored.
@startuml
' A minimal sequence diagram
actor Customer
participant Shop
participant Payments

Customer -> Shop: Place order
Shop -> Payments: Charge card
Payments --> Shop: Approved
Shop --> Customer: Show receipt
@enduml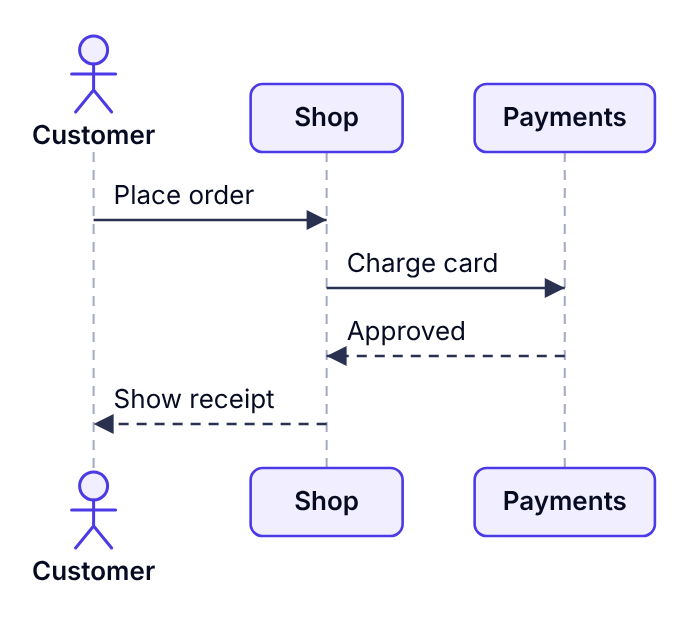
A few conventions are worth noticing:
@startumland@endumlmark where a diagram begins and ends. One file can hold several diagrams.actorandparticipantdeclare the people and systems involved. Declaring them is optional, but doing so lets you control their order and shape.->draws a solid arrow (a request);-->draws a dashed one, which is the usual way to show a reply.- Text after the colon becomes the arrow's label.
What you can draw with PlantUML
PlantUML started with UML diagrams and has grown well beyond them. The most commonly used types are:
| Diagram | What it shows | Typical keyword |
|---|---|---|
| Sequence | Messages between participants over time | A -> B: message |
| Activity | Steps, decisions, loops and parallel work in a process | start, :step;, if |
| Class | Classes, their fields and relationships | class |
| Component and deployment | How a system is split into parts and where they run | component, node |
| State | States an object can be in and the transitions between them | [*] --> State |
| Use case | Who uses a system and for what | usecase |
It can also draw non-UML diagrams such as mind maps, Gantt charts and wireframes, but sequence and activity diagrams remain the most popular in day-to-day engineering work.
Strengths and limitations
Where PlantUML shines
- Documenting API calls, authentication flows and other request/response interactions.
- Keeping architecture documents in version control alongside the code.
- Generating diagrams automatically in a documentation pipeline.
Where it can frustrate
- Limited layout control. Because the tool decides positions, getting a box exactly where you want it can take trial and error.
- A syntax to learn. The basics take minutes, but advanced features (styling, layout hints) take longer.
- Setup. The full tool needs Java, and some diagram types also need Graphviz, unless you use a server or a plugin that bundles them.
For free-form architecture sketches where exact placement matters, a drag-and-drop editor such as Dev Studio's Design Studio is often quicker.
Using PlantUML syntax in Dev Studio
Dev Studio's Sequence Diagram and Activity Diagram tools read PlantUML syntax and draw the diagram directly in your browser. There is nothing to install, and your text is never sent to a server.
skinparam are ignored. If you need the exact PlantUML output, render the same text with the official PlantUML tool.To try it, press Open in Sequence Diagram on the example above, change a message, and watch the diagram update.
Next steps
Once the basic idea clicks, the fastest way to get comfortable is to draw a flow you already know, such as your own login or checkout process. The guides below walk through each diagram type in detail.