How developers use diagrams in software development
Code is the final truth about how a system behaves, but it is a poor way to explain a system to someone new. Diagrams fill that gap: they compress thousands of lines into a picture a person can hold in their head. Used well, they shorten design discussions, speed up onboarding and catch mistakes before they become bugs.
This article looks at where diagrams earn their keep, which kind of diagram fits which job, and how to stop them from going stale.
Where diagrams help most
Design discussions
Before building something non-trivial, a quick diagram lets the team argue about the shape of the solution instead of the details of the code. Questions like "should this be synchronous?" or "which service owns this data?" are much easier to answer when everyone is looking at the same boxes and arrows.
Onboarding
A new team member can learn a system's main components in minutes from a good architecture diagram, rather than piecing it together from code over weeks.
Code review and design records
A sequence diagram attached to a pull request or an architecture decision record shows reviewers the intended behaviour, so they can check the code against it. Because text-based diagrams change alongside the code, the diff shows exactly what changed in the design.
Incident reviews
After an outage, a timeline or sequence diagram of what actually happened (which request timed out, which retry piled on) makes the root cause clear to people who weren't on call.
Talking to non-developers
Product managers, support teams and auditors rarely read code. A flowchart of a refund process or a swimlane diagram of an approval flow gives them an accurate picture they can question and improve.
Which diagram for which job
| Diagram | Best for | In Dev Studio |
|---|---|---|
| Architecture / system context | Major components, external systems and how they connect | Design Studio |
| Sequence diagram | Request flows, APIs, authentication, integrations | Sequence Diagram |
| Activity diagram | Workflows with decisions, loops, parallel steps and swimlanes | Activity Diagram |
| Flowchart | Simple processes and decision logic, especially for mixed audiences | Flow Diagram |
| Entity-relationship diagram | Database tables and how they relate | Not currently supported |
| State diagram | Lifecycles such as an order moving from pending to shipped | Not currently supported |
A popular way to organise architecture diagrams is the C4 model, created by Simon Brown. It describes a system at four zoom levels: system context (the system and the people and systems around it), containers (applications and data stores), components (the major parts inside one container) and code. Most teams find the first two levels give the most value for the least effort.
Diagrams as code vs drawing tools
There are two broad ways to make diagrams, and both have a place.
Diagrams as code (PlantUML, Mermaid)
- Pros: stored as text in version control, reviewable in pull requests, consistent styling, quick to edit, and easy to generate automatically.
- Cons: limited control over layout, a syntax to learn, and less suitable for free-form sketches.
Drag-and-drop editors
- Pros: exact positioning, free-form layouts, good for presentations and whiteboard-style thinking.
- Cons: harder to review changes, and they tend to drift out of date because updating them takes effort.
A practical split: use text-based diagrams for flows that change with the code (sequences, activities), and a visual editor for high-level architecture pictures that change rarely.
@startuml
actor Developer
participant "Git host" as Git
participant CI
actor Reviewer

Developer -> Git: Open pull request
Git ->> CI: Run tests
CI --> Git: All checks passed
Git -> Reviewer: Request review
Reviewer -> Git: Read code and diagram diff
Reviewer --> Git: Approve
Developer -> Git: Merge
@enduml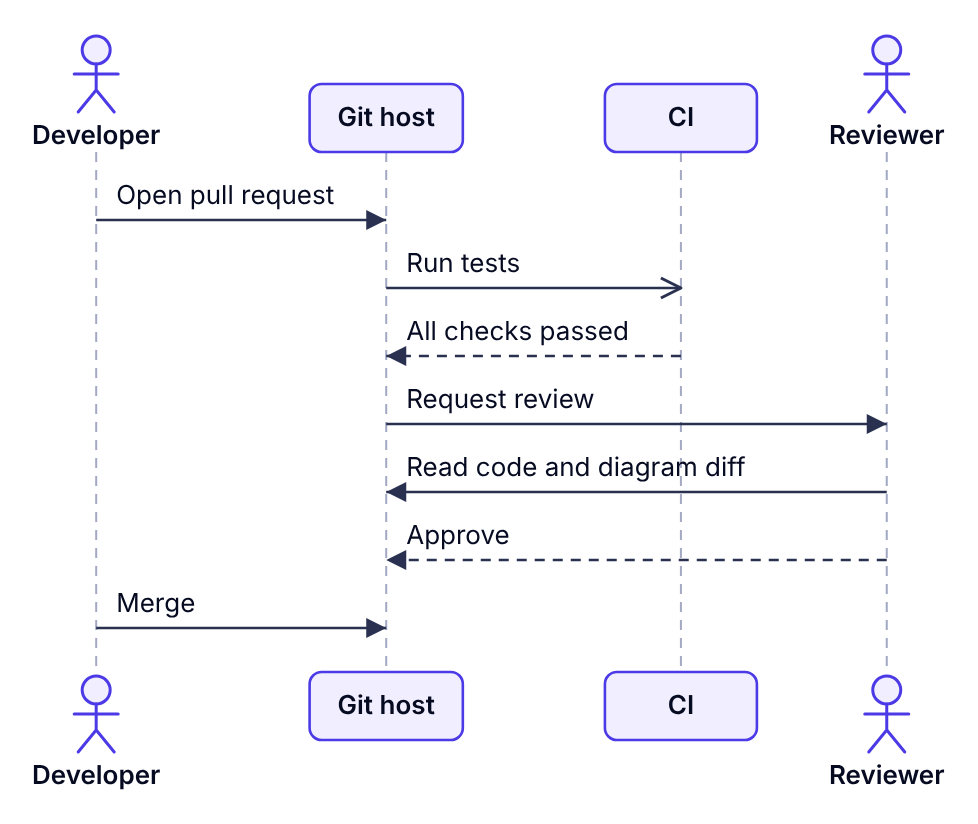
Keeping diagrams accurate
An out-of-date diagram is worse than none, because people trust it. These habits help:
- Store diagrams next to the code they describe, ideally as text files, so they're visible when that code changes.
- Give each diagram one purpose and one audience. "Checkout payment flow for backend developers" is maintainable; "the whole system" is not.
- Add a title and a date, so readers can judge how fresh it is.
- Update diagrams in the same pull request as the behaviour change, and ask reviewers to check them.
- Delete diagrams nobody uses. Fewer, accurate diagrams beat many stale ones.
A starter set for a new project
- One context diagram: the system, its users and the external services it depends on.
- One container diagram: the apps, APIs, databases and queues inside the system.
- A sequence diagram for each critical flow, such as sign-in, payment or data import.
- An activity diagram or flowchart for any process with significant business rules.
That's usually five to ten diagrams, enough to explain a system without creating a documentation burden.